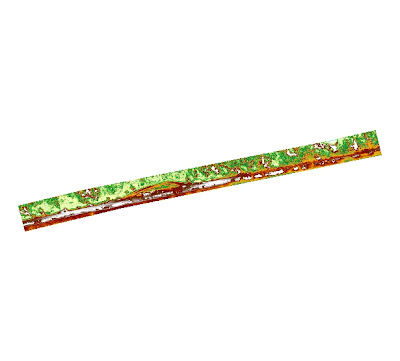
 Difference in elevation map
02 August 2009
27 July 2009
Unsupervised Classification
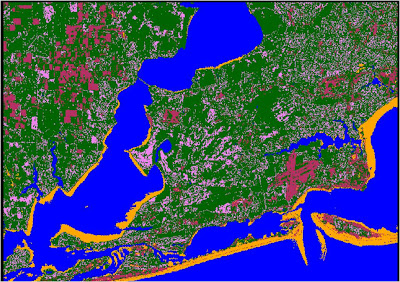
Here is a reclassified image of Pensacola, FL. Most areas were easy to reclassify including sand, forests, and water. The areas that were tough to reclassify and combine were the residential, high density urban areas, and grass. Without additional data on land use it is difficult to clearly classify this image. Grass areas are difficult as well because you cannot clearly see them on the original image. I think I completed this to the best of my ability with the given data.
21 July 2009
Usefulness or pitfalls of image rectification
Image rectification is very useful for the various photos, scanned drawings, and the many other images available today with no spatial reference. In my job, I deal with this issue everyday. Someone will walk into my office with a picture, or old hard copy drawing and want me to incorporate other accurate GIS data on top of the image. Being able to rectify these images make these images useful again. If they were nothing but a picture, most of them would just end up stuffed in a drawer. Today we can rectify these old images for use not only in GIS but for historical preservation.
Pitfalls that come into play include poor resolution of images that make it hard for the user to be able to select distinguishable reference points. Also, images may be too warped to be able to rectify properly for use with other data.
Pitfalls that come into play include poor resolution of images that make it hard for the user to be able to select distinguishable reference points. Also, images may be too warped to be able to rectify properly for use with other data.
14 July 2009
Fort-Worth Thermal Image
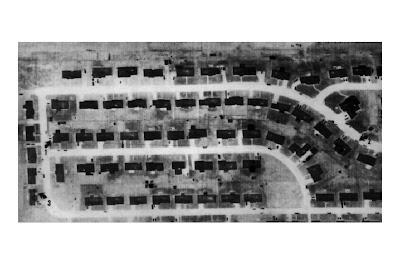 1. Provide a brief description of why the following features appear as they do in this thermal infrared image:
Roads - Bright color.Pavement heats up quicker in the morning and retains heat over night.
Natural and man-made vegetation - medium brightness. Barren ground will hold more heat over night than grassy areas. Lighter ground in the image will appear warmer than darker greener areas.
Sidewalks and patios - bright color. Concrete walkways and patios will hold more heat overnight as well and will heat up quicker in the morning sunlight.
Storage sheds in back yards - dark color. Sheds have probably not been hit by the sunlight yet as the houses are blocking them.
Automobiles – medium dark to full dark. If the cars have been run recently then the fronts will be whiter and if they haven’t they will be darker. Also, cars will appear darker if they haven’t been in the sun yet.
Bright spots on many of the roof tops – roof vents that are metal will attract sun quicker and show hotter.
08 July 2009
Multispectral and Panchromatic image of Marco Island Analysis
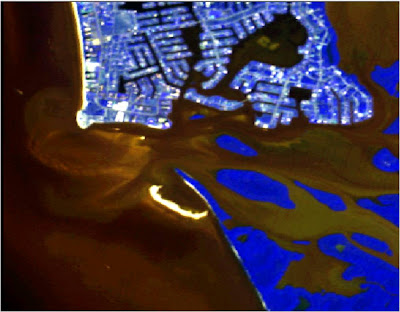
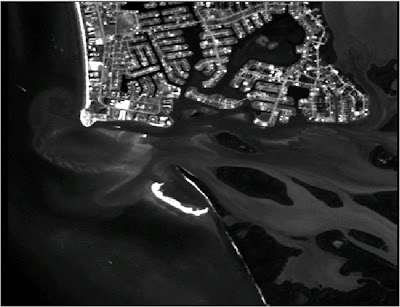 The first image is a multispectral image showing bands Red=2, Green=3, and Blue=4. By heightening the blue band you can see water penetrations through the vegetation, and clearly distinguish shorelines. You can notice the brighter the blue color, the higher the moistue content. You can also see sandy areas along the coastlines where there is no water penetration.
The second image is a panchromatic image which displays black and white colors, whith bands: Red=1, Green=1, and Blue=1. This image is hard to derive anything from. The only thing visible is vegetation, water, and land areas. This image would only be usable as a background map since no spectral data could be gained.
29 June 2009
Aerial Photograph

2. What problems might you infer or identify in using this type of photograph?
- In this photo, true colors cannot be seen so it is not an easy photo to study. Also, even though types of land are contrasted differently (forested areas, bare land, etc...) you cannot distinguish the specific types because in the photo everything has a red contrast. For example: On the golf course you can distinguish fairways and rough areas, but it is difficult to make out greens, tee boxes, bunkers, etc... If this was in true color then you could make out the specific details. Lastly, the scale of this photo may affect the users ability to perform on-screen digitizing. The features may not be clear enough to accurately map.
28 April 2009
Michigan Wind Farm Location
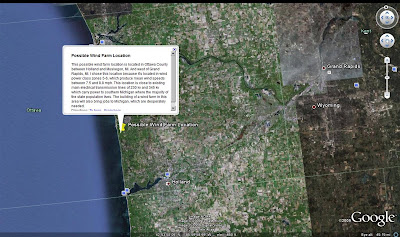
I chose a location between Holland and Muskegon, just west of Grand Rapids, MI. This location has mean wind speeds between 7.5 and 8.8mph on average. It would be close to existing electrical transmission lines that power southern Michigan. Being positioned along the coast would allow the farm to work quietly without disturbing nearby cities, but provide more local jobs to the area.
26 April 2009
Isohyet Map
19 April 2009
Immigration Flow Map
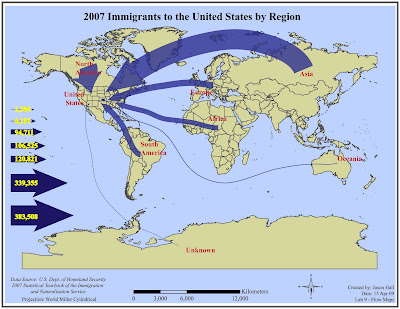 I chose a 40pt line weight for the largest line and the World Miller Cylindrical projection. This map was interesting to see on the blog. Others broke up the regions and spaced them around the map and some chose to do like I did with the whole world in view. After looking on the internet, I saw someone just show the US with line coming in and no other regions shown. All seem to be right, I just prefer to show the overall view.
Subscribe to:
Comments (Atom)


