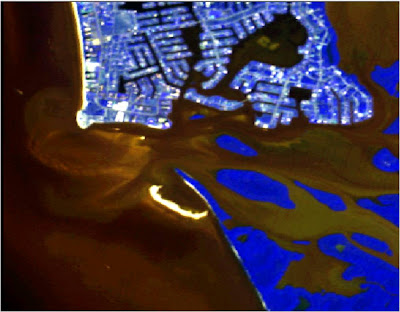
 The first image is a multispectral image showing bands Red=2, Green=3, and Blue=4. By heightening the blue band you can see water penetrations through the vegetation, and clearly distinguish shorelines. You can notice the brighter the blue color, the higher the moistue content. You can also see sandy areas along the coastlines where there is no water penetration.
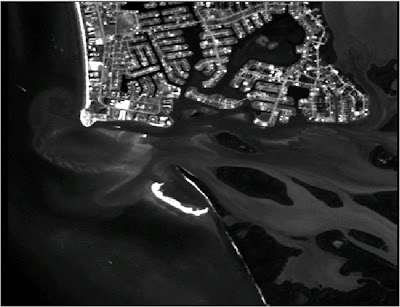
The second image is a panchromatic image which displays black and white colors, whith bands: Red=1, Green=1, and Blue=1. This image is hard to derive anything from. The only thing visible is vegetation, water, and land areas. This image would only be usable as a background map since no spectral data could be gained.


Each has it's own purpose so you would want to use the together to get a better understanding of the area
ReplyDelete